Ex. 8: Outflow of Mediterranean Water into the Atlantic Ocean

High salinity water from the Eurafrican Mediterranean Sea enters the Atlantic Ocean between Africa and Spain through the Strait of Gibraltar where the sill depth is approximately 320 m. It immediately sinks to the level of its own density and can be traced across a large area of the North Atlantic as a sheet of high salinity. This exercise looks at the impact of Mediterranean Water on the water mass properties of the Atlantic Ocean.
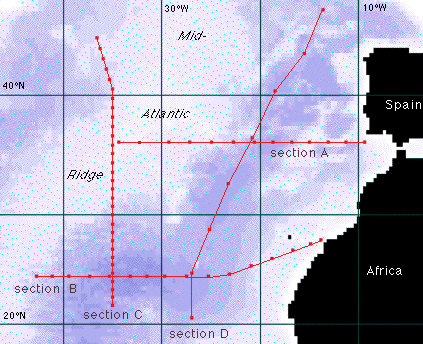
You are supplied with temperature and salinity data from hydrographic stations along the four sections in the eastern North Atlantic shown on the map. There are various ways of assessing the impact of Mediterranean Water with these sections. All use salinity as the most important indicator. Some use salinity in conjunction with temperature. Read and consider all options before you decide how to proceed with your work.
- In a zonal salinity section, Mediterranean Water will show up as a tongue of high salinity, particularly if the section is chosen such that its eastern end is close to the entry point into the Atlantic Ocean. The highest salinity will be found near the Strait of Gibraltar; the salinity maximum will gradually fade away as the water is followed westward.
- In a meridional section, Mediterranean Water will show up as a lens of high salinity water where it crosses the section (This assumes that the major direction of spreading is westward, which is reasonably close to what is observed.)
- The spreading of Mediterranean Water across the eastern North Atlantic can be investigated by plotting the depth of the salinity maximum and the salinity at that depth in space. To do this, you print the base map, which contains the station positions for the 4 sections. For each station you identify the depth of the core of the Mediterranean Water (i.e. the depth of the salinity maximum) and write it next to the station; if possible and sensible you can contour the depth of the maximum. This gives you a map of the depth where the largest contribution of Mediterranean Water is found in the water column. Next you identify the salinity value at the depth of the maximum. On another copy of the base map you write the salinity values next to the stations and contour the salinity. This shows you how the salinity in the core of the Mediterranean Water decreases with distance from the source as a result of mixing.
- A TS-diagram can be used to get information about the effect of mixing on the core of the Mediterranean Water. You simply plot temperature and salinity of a suitable sequence of stations (beginning in the vicinity of the Strait of Gibraltar and moving away from it) in a single TS-diagram. Assuming that unmixed Mediterranean Water enters the Atlantic Ocean with 12.0 ºC and a salinity of 36.6 and observing the shape of the TS-curve without influence of Mediterranean Water, you can then determine the relative amount of Mediterranean Water found in its core. (You use the so-called mixing triangle technique.)
This exercise offers you calculators and graphic facilities to perform the task. You have to decide how to proceed with the exercise, i.e. which of the four options to select. Questions you might want to ask yourself could be:
- At which station does the observed outflow come closest to undiluted Mediterranean Water (12.0 ºC and 36.6 salinity), and what are the temperature and salinity in the core of the outflow at that station ?
- How far from the Strait of Gibraltar do you have to go until the salinity in the salinity maximum is less than 35.5, and where do you find such conditions ?
- Alternatively, how far from the Strait of Gibraltar do you have to go until the salinity in the Mediterranean Water contribution has been rduced to less than 10%, and where do you find such conditions ?
Other questions are of course possible; you might find alternatives to the two proposed questions after having studied the data.


