

| depth (m) | T (º) at A | T (º) at B |
|
0 20 50 75 100 150 200 300 500 700 900 1100 1300 1500 2000 2500 |
19.05 19.10 18.80 18.64 18.55 17.45 16.13 13.68 10.05 7.90 6.28 4.92 3.89 3.23 2.37 1.98 |
19.38 19.36 19.34 19.29 19.17 19.07 18.90 16.83 14.09 8.73 6.47 4.98 3.95 3.28 2.38 1.98 |
In the ocean interior (i.e. below the surface mixed layer and away from coastlines) water movement is geostrophic and currents can therefore be determined from observations of temperature and salinity. This exercise shows the principle of geostrophic current calculation. It consists of the following steps:
The exercise assumes some familiarity with the concepts involved (steric height, geostrophy, mass and volume transports) but explains them in elementary form as the calculation proceeds. It introduces the concept with a set of two artificial stations and applies it to two oceanic situations (one in the North Atlantic Ocean, one in the tropical Indian Ocean).
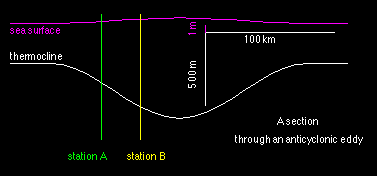
The model data contain artificial temperature and salinity data and simulate the situation in a geostrophic eddy:

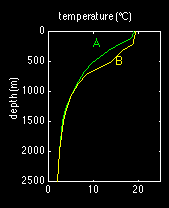
Temperature T and salinity S are given at two stations A and B in the region of strongest flow on the flank of the eddy. The thermocline is the region where T and S change most rapidly with depth; it can therefore be identified with any of several isotherms (for example the 15º isotherm) or isohalines.
Station B is closer to the eddy centre than station A. At any given depth, station A therefore shows lower temperatures than station B. Make sure you understand the difference between the temperature profiles for both stations before you proceed. (You may want to verify, for example, where the thermocline - in the form of the 15º isotherm - is located at the two stations and how that is reflected in the temperature profiles and in the tables.)