

![]()
![]()
![]()
![]()
![]()
The oceanic heat budget consists of inputs and outputs. "Input" identifies a process through which the ocean gains heat, while "output" represents a heat loss to the ocean. A complete list of all inputs and outputs is as follows; + indicates input or heat gain, - signifies output or heat loss:
Primary inputs and outputs
The contributions from secondary sources are negligible for most applications. The following discussion addresses only the primary inputs and outputs.
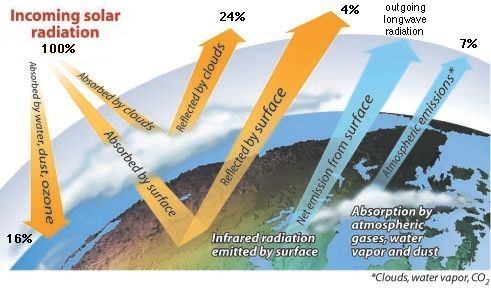 Figure 4.1
Energy from the sun at the outer limit of the atmosphere at normal incidence amounts to 2.00 cal cm-2 min-1 (the "solar constant"). Variations in the intensity of the incoming radiation are of regular and irregular character. Seasonally the solar radiation varies between zero and 1100 cal cm-2 day-1 at the poles and 800 - 900 cal cm-2 day-1 at the equator. Maximum interannual variations arise from the variation of the distance between the earth and the sun and amount to 3.34%; they can be predicted and explain the major climate changes over geological time.
In the modern literature the unit cal cm-2 day-1 (calories per square centimeter per day) has been replaced by the unit W m-2 (Watts per square meter). The translation between units is achieved by noting that 1 calorie (cal) = 4.184 Joules (J) and 1 Watt (W) = 1 Joule per second (J s-1). This gives a conversion factor of 1 cal cm-2 day-1 = 0.484 W m-2. In other words, a heat input of 1000 cal cm-2 day-1 converts roughly to 500 W m-2.
Not all of the radiation received at the outer atmosphere is available to the ocean (Figure 4.1). If the incoming radiation is normalised to 100%, then
16% are absorbed in the atmosphere
24% are reflected by clouds
7% are radiated back to space from the atmosphere
4% are reflected from the earth's surface (mainly from the sea)
Thus, 35% returns into space, while 65% are available as energy. (The equivalent of 16% is stored in the atmosphere and therefore available eventually.)
The incoming radiation is emitted from the sun at ~6000 K (Kelvin, equivalent to the Celsius scale but with a shift in scale such that 0ºC corresponds to 273 K). According to Wien's Law, maximum radiation occurs at a wavelength given by λ = 2897 T-1, where T is in degrees K and λ (lambda) the wavelength in micrometers. Maximum radiation from the sun therefore occurs in the wavelength range of visible light and peaks at 0.48 micrometers, which is in the blue range. It decays rapidly towards shorter wavelengths (in the ultraviolet or UV) and slowly towards longer wavelengths (in the infrared).
Solar energy received by the ocean varies irregularly with wavelength, as a result of absorbtion by water vapour and the various atmospheric gases, particularly oxygen and hydrocarbon. Absorption in the sea reduces the light level rapidly with depth (Figure 4.2). At vertical light incidence (ie most favourable conditions),
 Figure 4.2
73% reaches 1 cm depth
44.5% reaches 1 m depth
22.2% reaches 10 m depth
0.53% reaches 100 m depth
0.0062% reaches 200 m depth
The minimum energy supply necessary to maintain photosynthesis is 0.003 cal cm-2 min-1. Under optimum conditions (absolutely clear water) this amount is available at 220 m depth.
Some of the radiation received from the sun is radiated back from the ocean surface. The wavelength where most of this back-radiation occurs is again given by Wien's Law. As the temperature of the sea surface is much lower than that of the sun (~283 K), maximum back radiation is found at 10 micrometers, i.e. in the infrared or heat radiation.
According to the Stefan-Boltzman Law, the energy of the radiation is proportional to the fourth power of the absolute temperature (temperature expressed in K). Thus, daily or seasonal variations in the ocean's surface temperature have little effect on the back radiation energy, since these variations are small compared to the absolute temperature level.
On average, the ocean surface is about 0.8 ºC warmer than the air above it. Direct heat transfer (transfer of sensible heat) therefore occurs usually from water to air and constitutes a heat loss. Heat transfer in that direction is achieved much more easily than in the opposite direction for two reasons:
51% of the heat input into the ocean is used for evaporation. In addition to the important contribution to the heat budget, evaporation - constituting a loss of water to the atmosphere - plays an important role in the mass budget, which will be discussed below.
Evaporation starts when the air is unsaturated with moisture. Warm air can retain much more moisture than cold air. As under normal conditions direct heat transfer is from the sea to the air (ie the air is normally heated from below), the normal situation is that the air is unsaturated with moisture and evaporation occurs. Condensation occurs where warm air is found over cold water. Such ocean areas are known and feared for the frequent occurrence of fog. Most of the energy released during condensation goes into the atmosphere, so the contribution of condensation to the oceanic heat budget is extremely small.
 Figure 4.3
The heat budget is the balance between the terms discussed above. Normally, the first two terms are not considered separately; the difference solar radiation minus oceanic back-radiation, or net radiative heat gain, is used as the major input. The balance is then
net radiative heat gain - evaporative heat loss - direct heat loss = 0
 Figura 4.4
This budget is closed if the world ocean is considered. If the budget is evaluated for limited ocean regions, the right-hand side is not usually zero but represents the heat transfer achieved by ocean currents. figure 4.3 gives the heat budget of the North Atlantic Ocean as an example. On the global scale, figure 4.4 shows the role of heat transport by currents in the heat budget in a zonal section from 60ºN to 60ºS. Net heat input decreases from the tropics towards the poles; it has a weak minimum near the equator because of heavy cloud cover in that region. The maximum of the evaporative heat loss in the subtropics is produced by atmospheric advection of dry air; the minimum in the tropics results from high moisture content of the tropical air. Sensible heat loss is small throughout. Currents remove heat from the tropics (this is a heat loss to the ocean - positive values) and deposit it in the subpolar regions ( a heat gain - negative values).
The mass budget involves the effects of evaporation and precipitation on the amount of water in the ocean. The effect on the total amount of water is significant only on a geological time scale. Its major importance for oceanographic applications lies in its influence on the salinity in the surface layer of the ocean.
The evaporation rate E, ie the loss of water due to evaporation over a given time span is proportional to the distribution of evaporative heat loss. The proportionality constant is known as the evaporation constant of water; it amounts to 585 cal g-1.
Precipitation P has to be taken from observations. It is high in the Doldrums (just north of the equator) and at the Polar fronts (at about 50º latitude).
The distribution of sea surface salinity mirrors the distribution of E-P over large parts of the ocean (Figure 4.5). Deviations occur from river run-off. On a global scale, the balance is
 Figure 4.5
Evaporation = 440.103 km3 year-1
Precipitation = 411.103 km3 year-1
River run-off = 29.103 km3 year-1
The melting and freezing of ice is balanced (except on the geological time scale). Most rivers are found in the northern hemisphere, so the proportionality between sea surface salinity and E-P is better over most of the southern hemisphere.
Note: Evaporation, precipitation and river run-off are expressed as volume per unit time. Modern oceanography uses more and more a unit called "sverdrup" (Sv), defined as 1 million cubic meters per second: 1 Sv = 106 m3 s-1. The conversion factor for km3 year-1 to Sv is 1000 km3 year-1 = 0.0317 Sv. This gives an evaporation of 14.0 Sv, a precipitation of 13.1 Sv and a total river run-off of 0.9 Sv.